With an undergraduate background in history and geography, a certificate in cartography and GIS (geographic information systems) provided the perfect opportunity for pursuing greater understanding of the mappable world and exploring the many ways its unique information can be visually conveyed. Following, is a small selection from the many projects I completed for the program.
research, analysis, print design, original composition
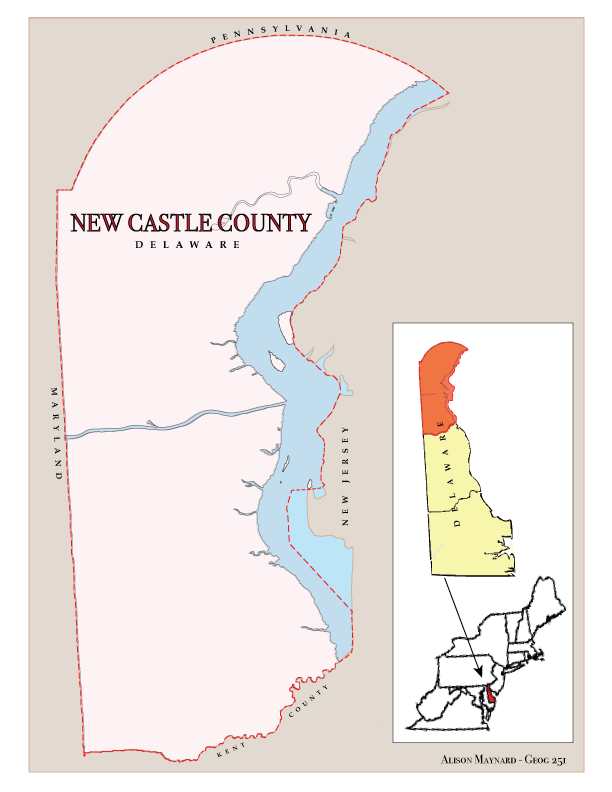
New Castle County—Four Maps
In this final project for a Computer Mapping course, I was asked to create four maps—boundary, political, physical, and thematic—representing the Delaware county of New Castle. The theme was up to my determination. (2018)
Employed: Adobe Illustrator & Photoshop
Created for 8.5" x 11" presentation

BOUNDARY MAP
POLITICAL MAP


PHYSICAL MAP
THEMATIC MAP
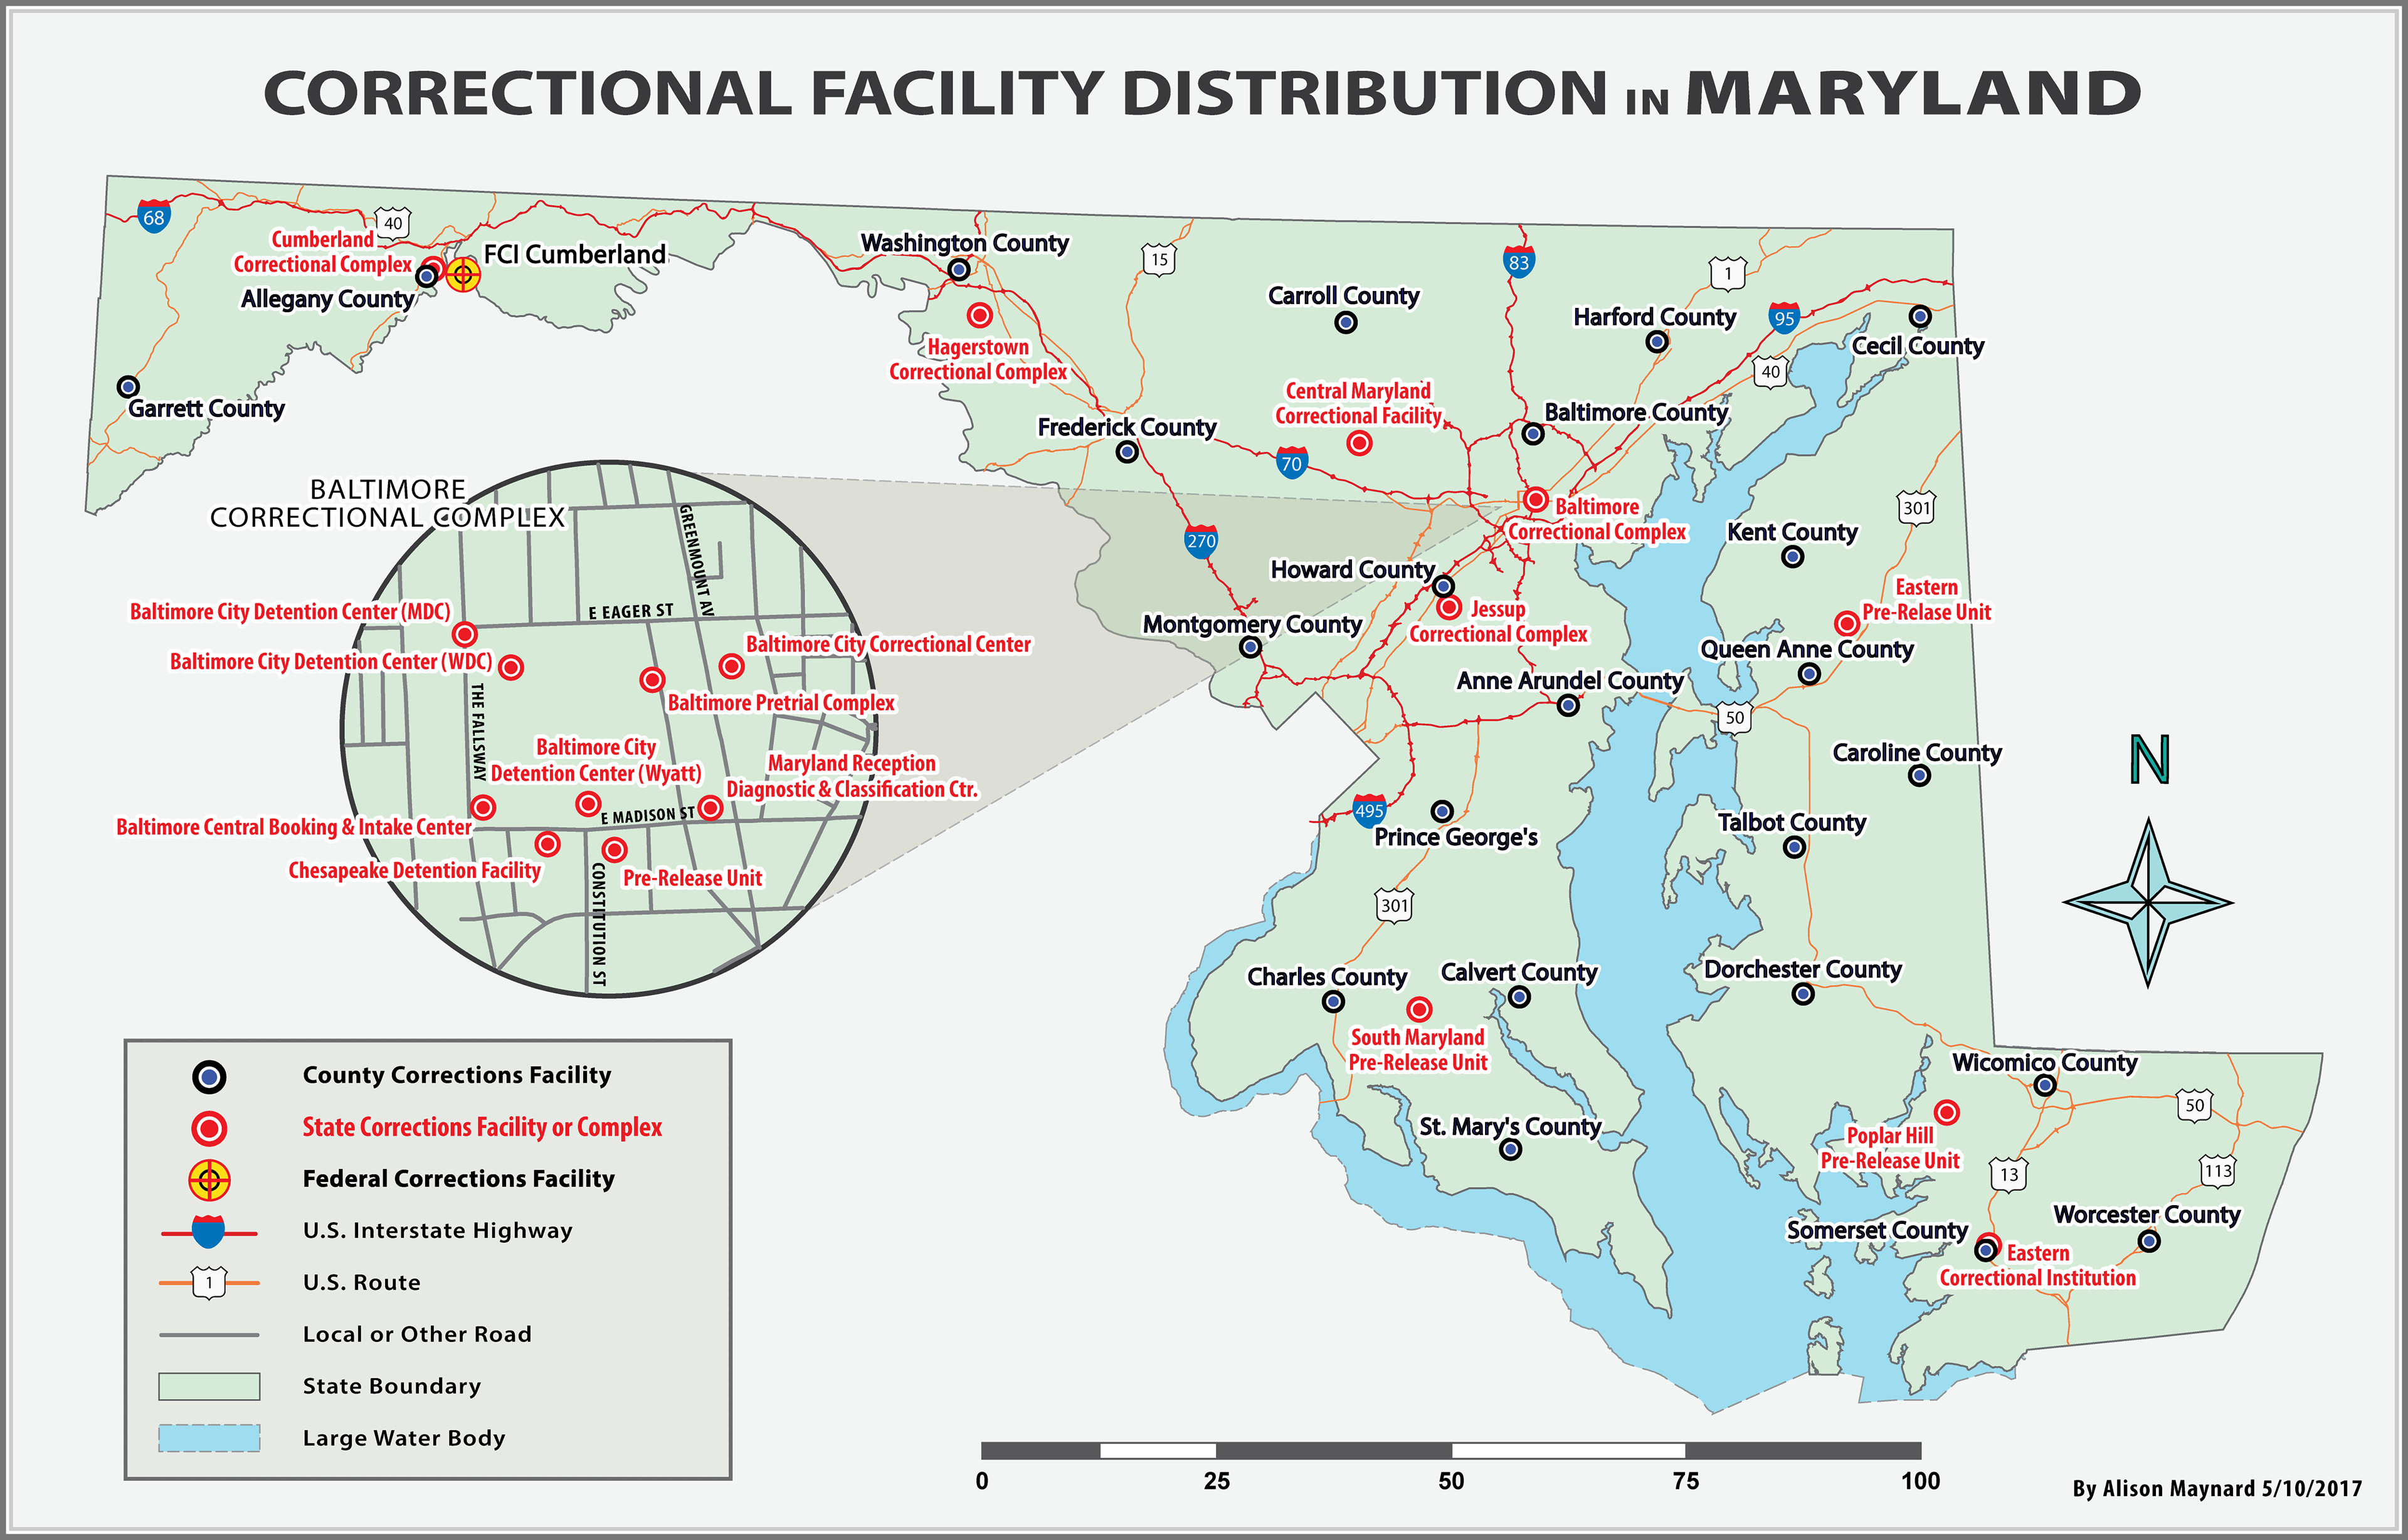
General Purpose Map with Inset
There's much insight that can be be gained through the visual impact of a thematic map. Seeing the distribution of correctional facilities throughout the state of Maryland illustrated in a map provides greater opportunities to observe correlations and impact. This assignment was to highlight a specific topic of my choice (within the Maryland State boundaries) that that included at least 20 data point locations and utilized an inset. (2017)
Employed: Adobe Illustrator, MAPublisher, & Photoshop
Created for 11" x 17" presentation
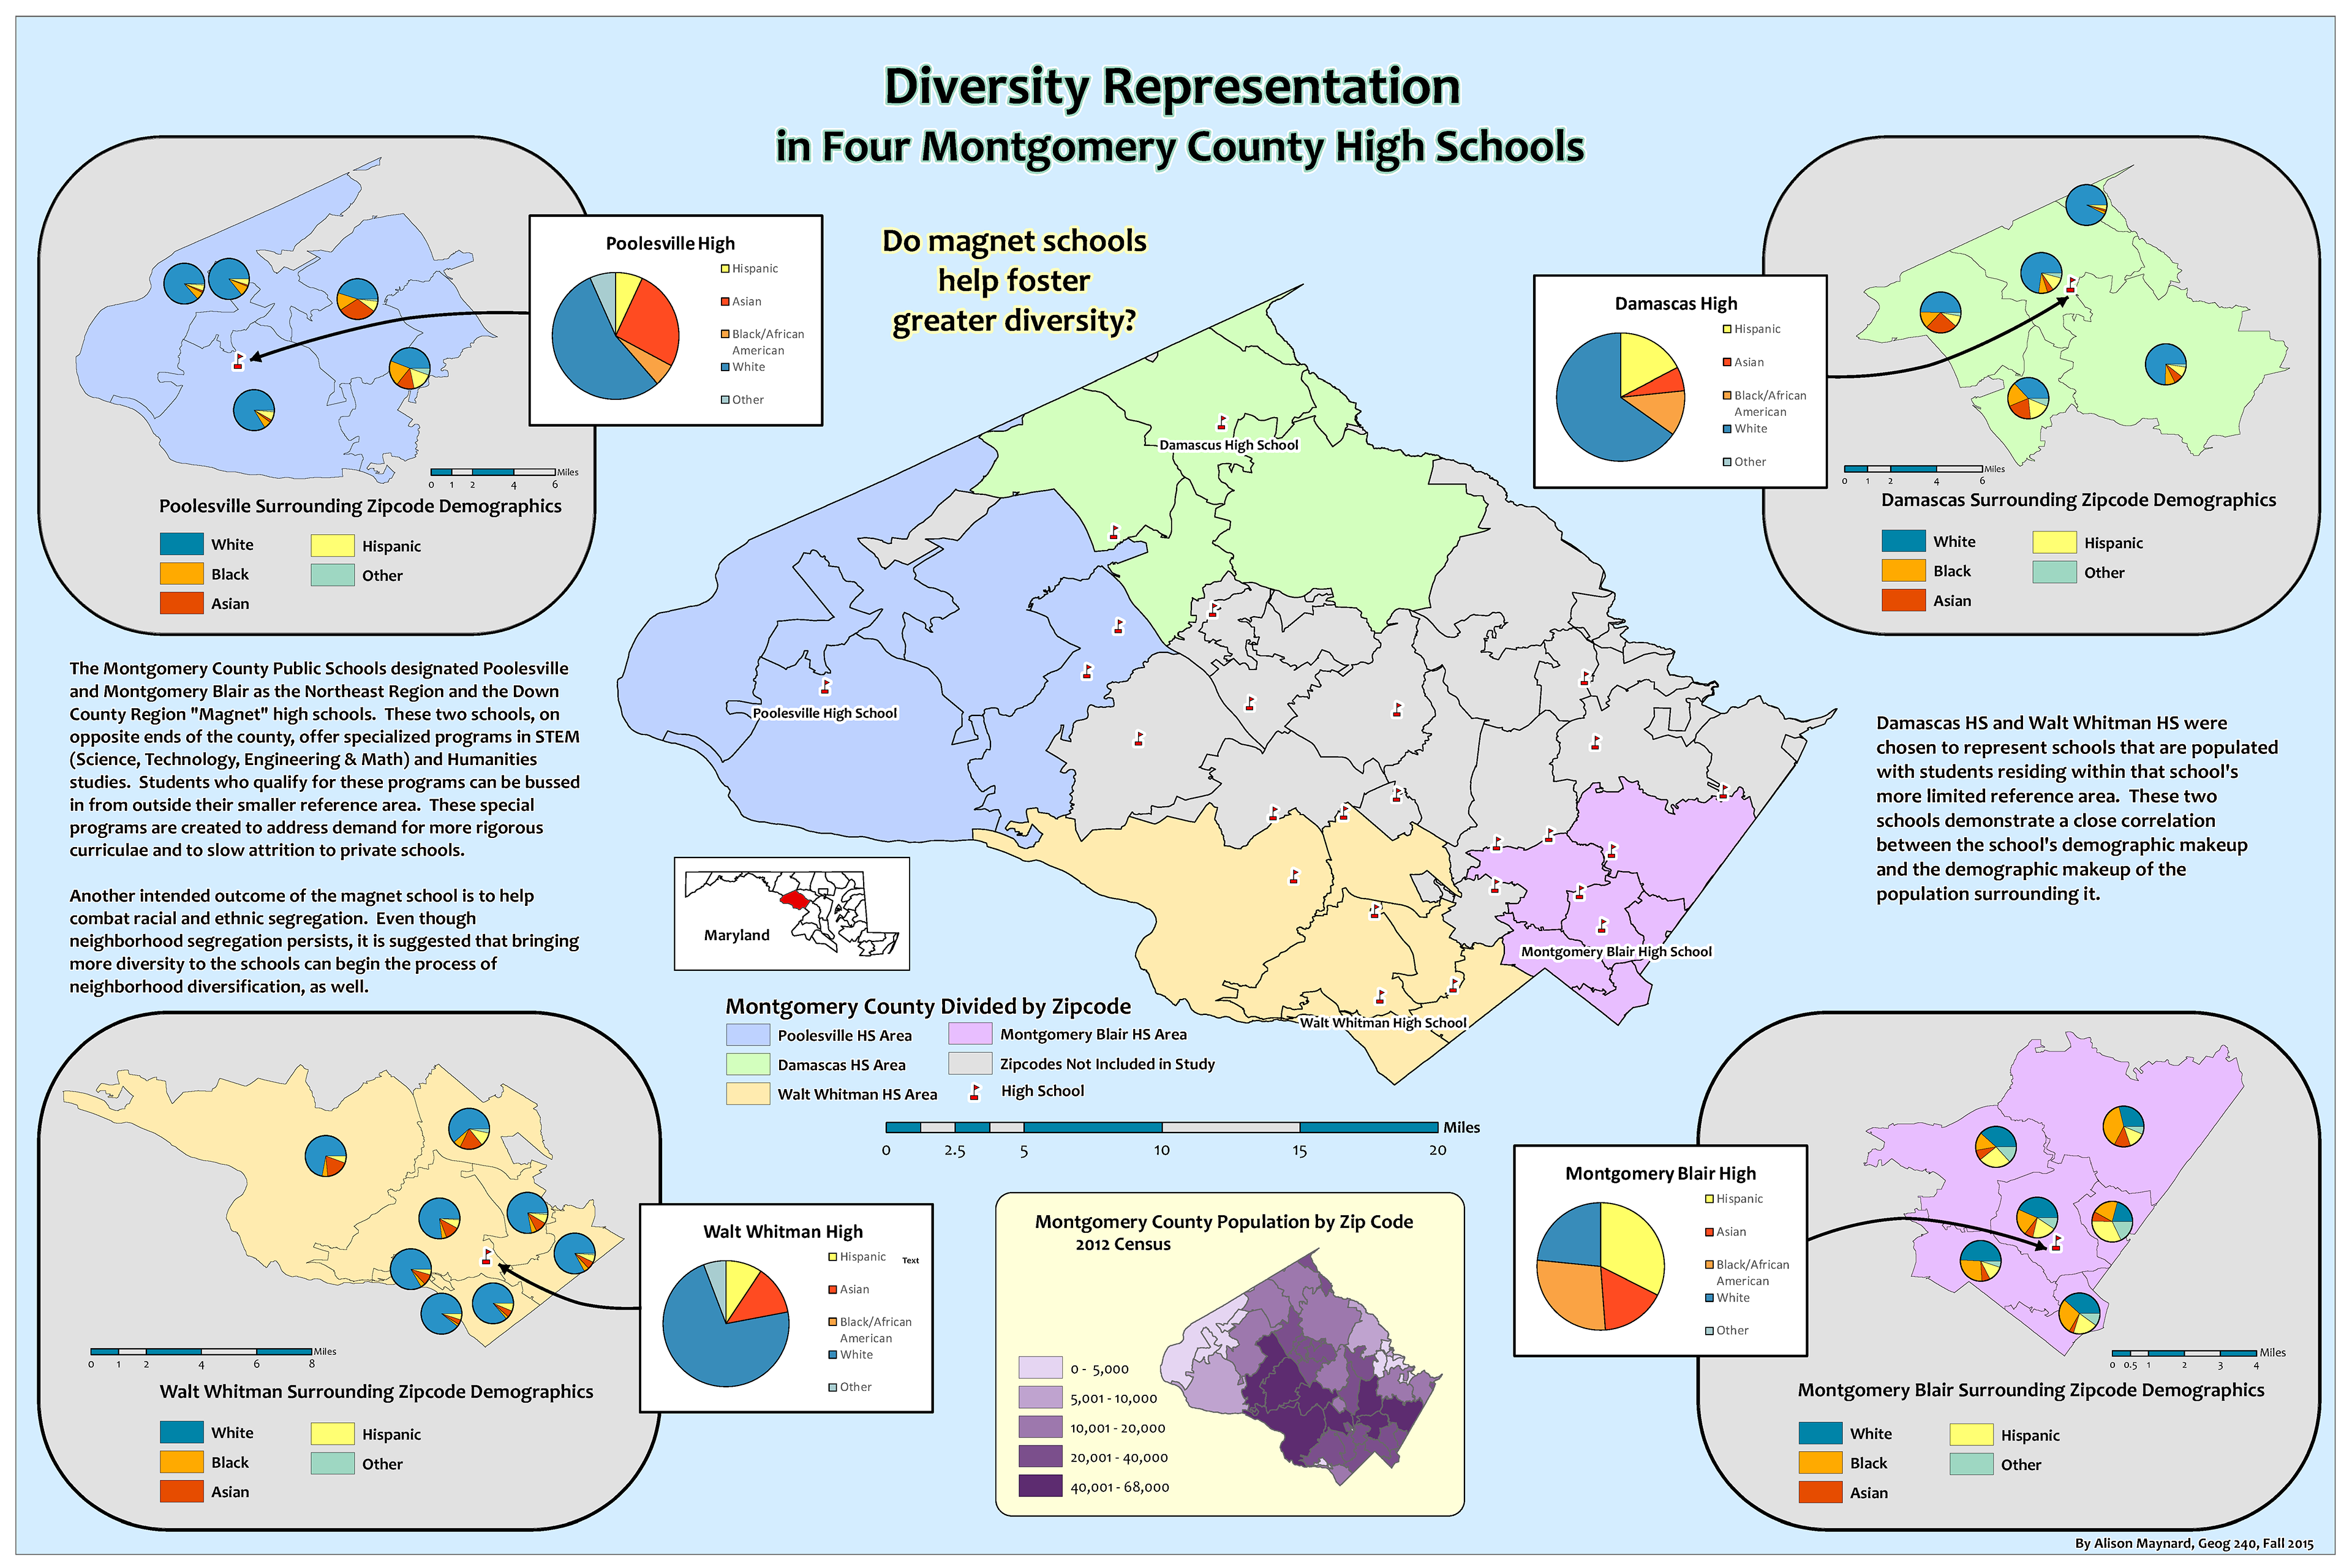
Mapping for Analysis
This final project, created for my initial GIS class, provided an opportunity to examine some possible effects of magnet schools on student diversity.
Employed: ArcGIS
Created for 24" x 30" presentation
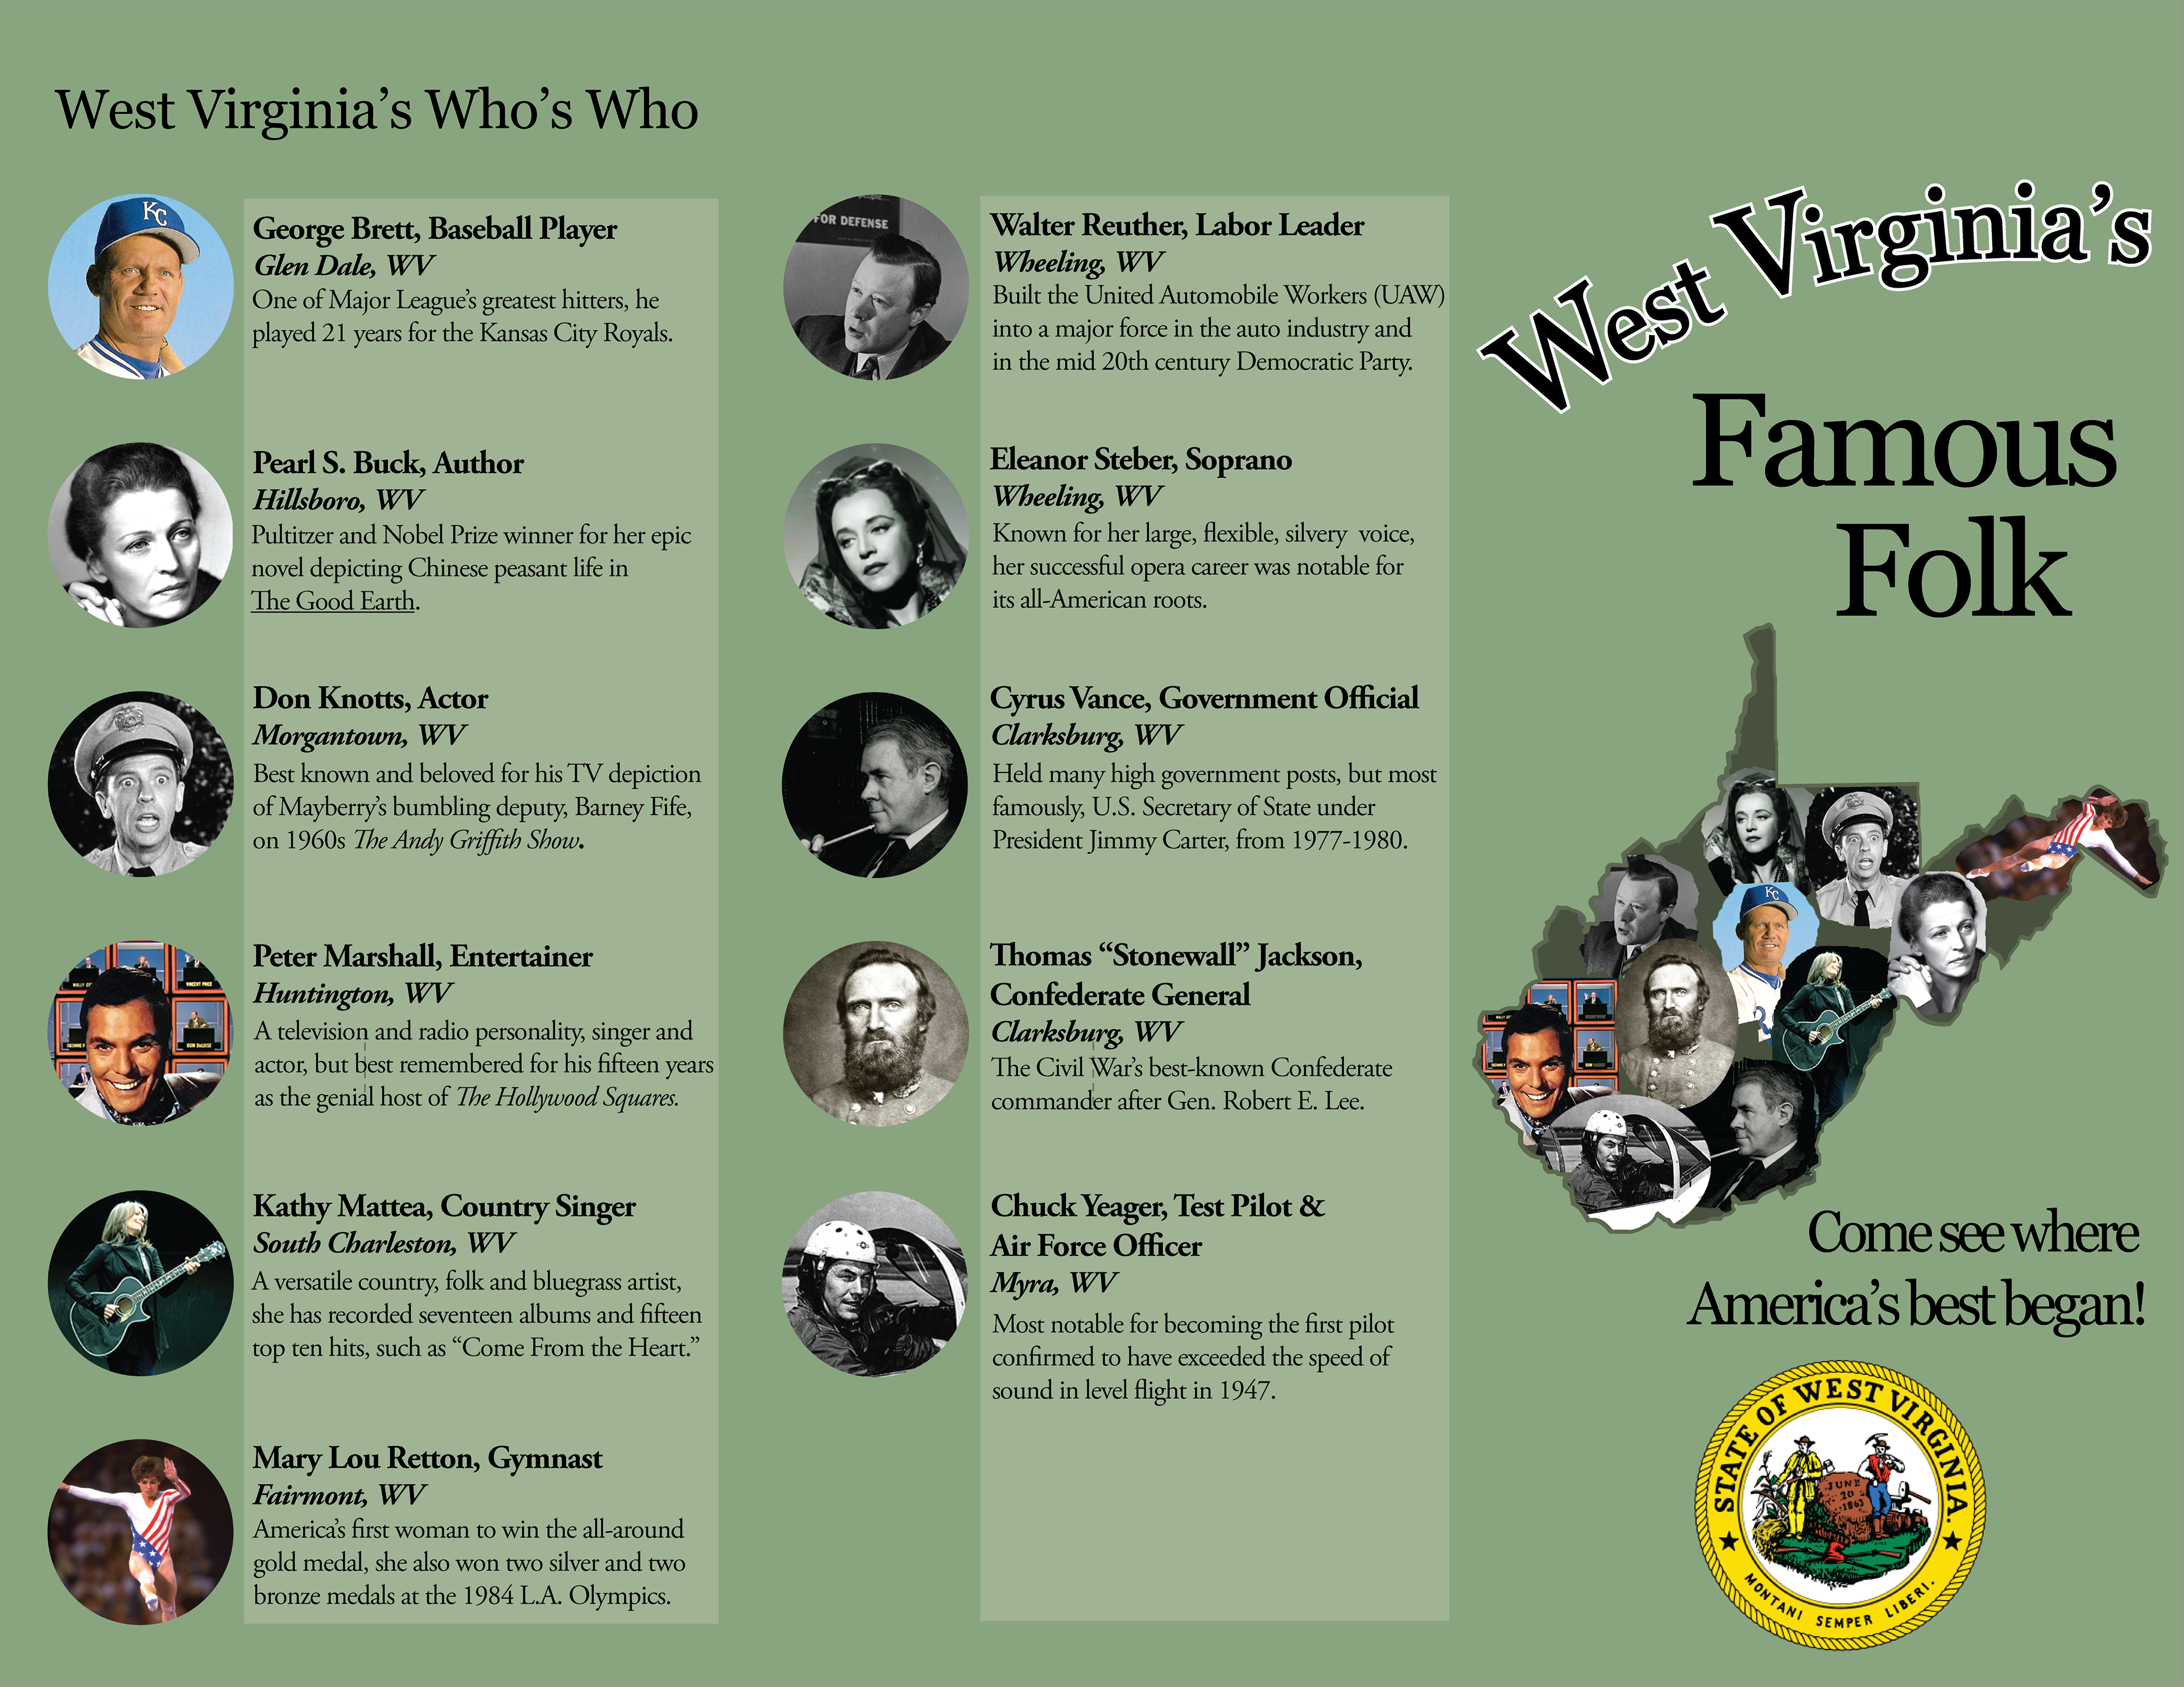
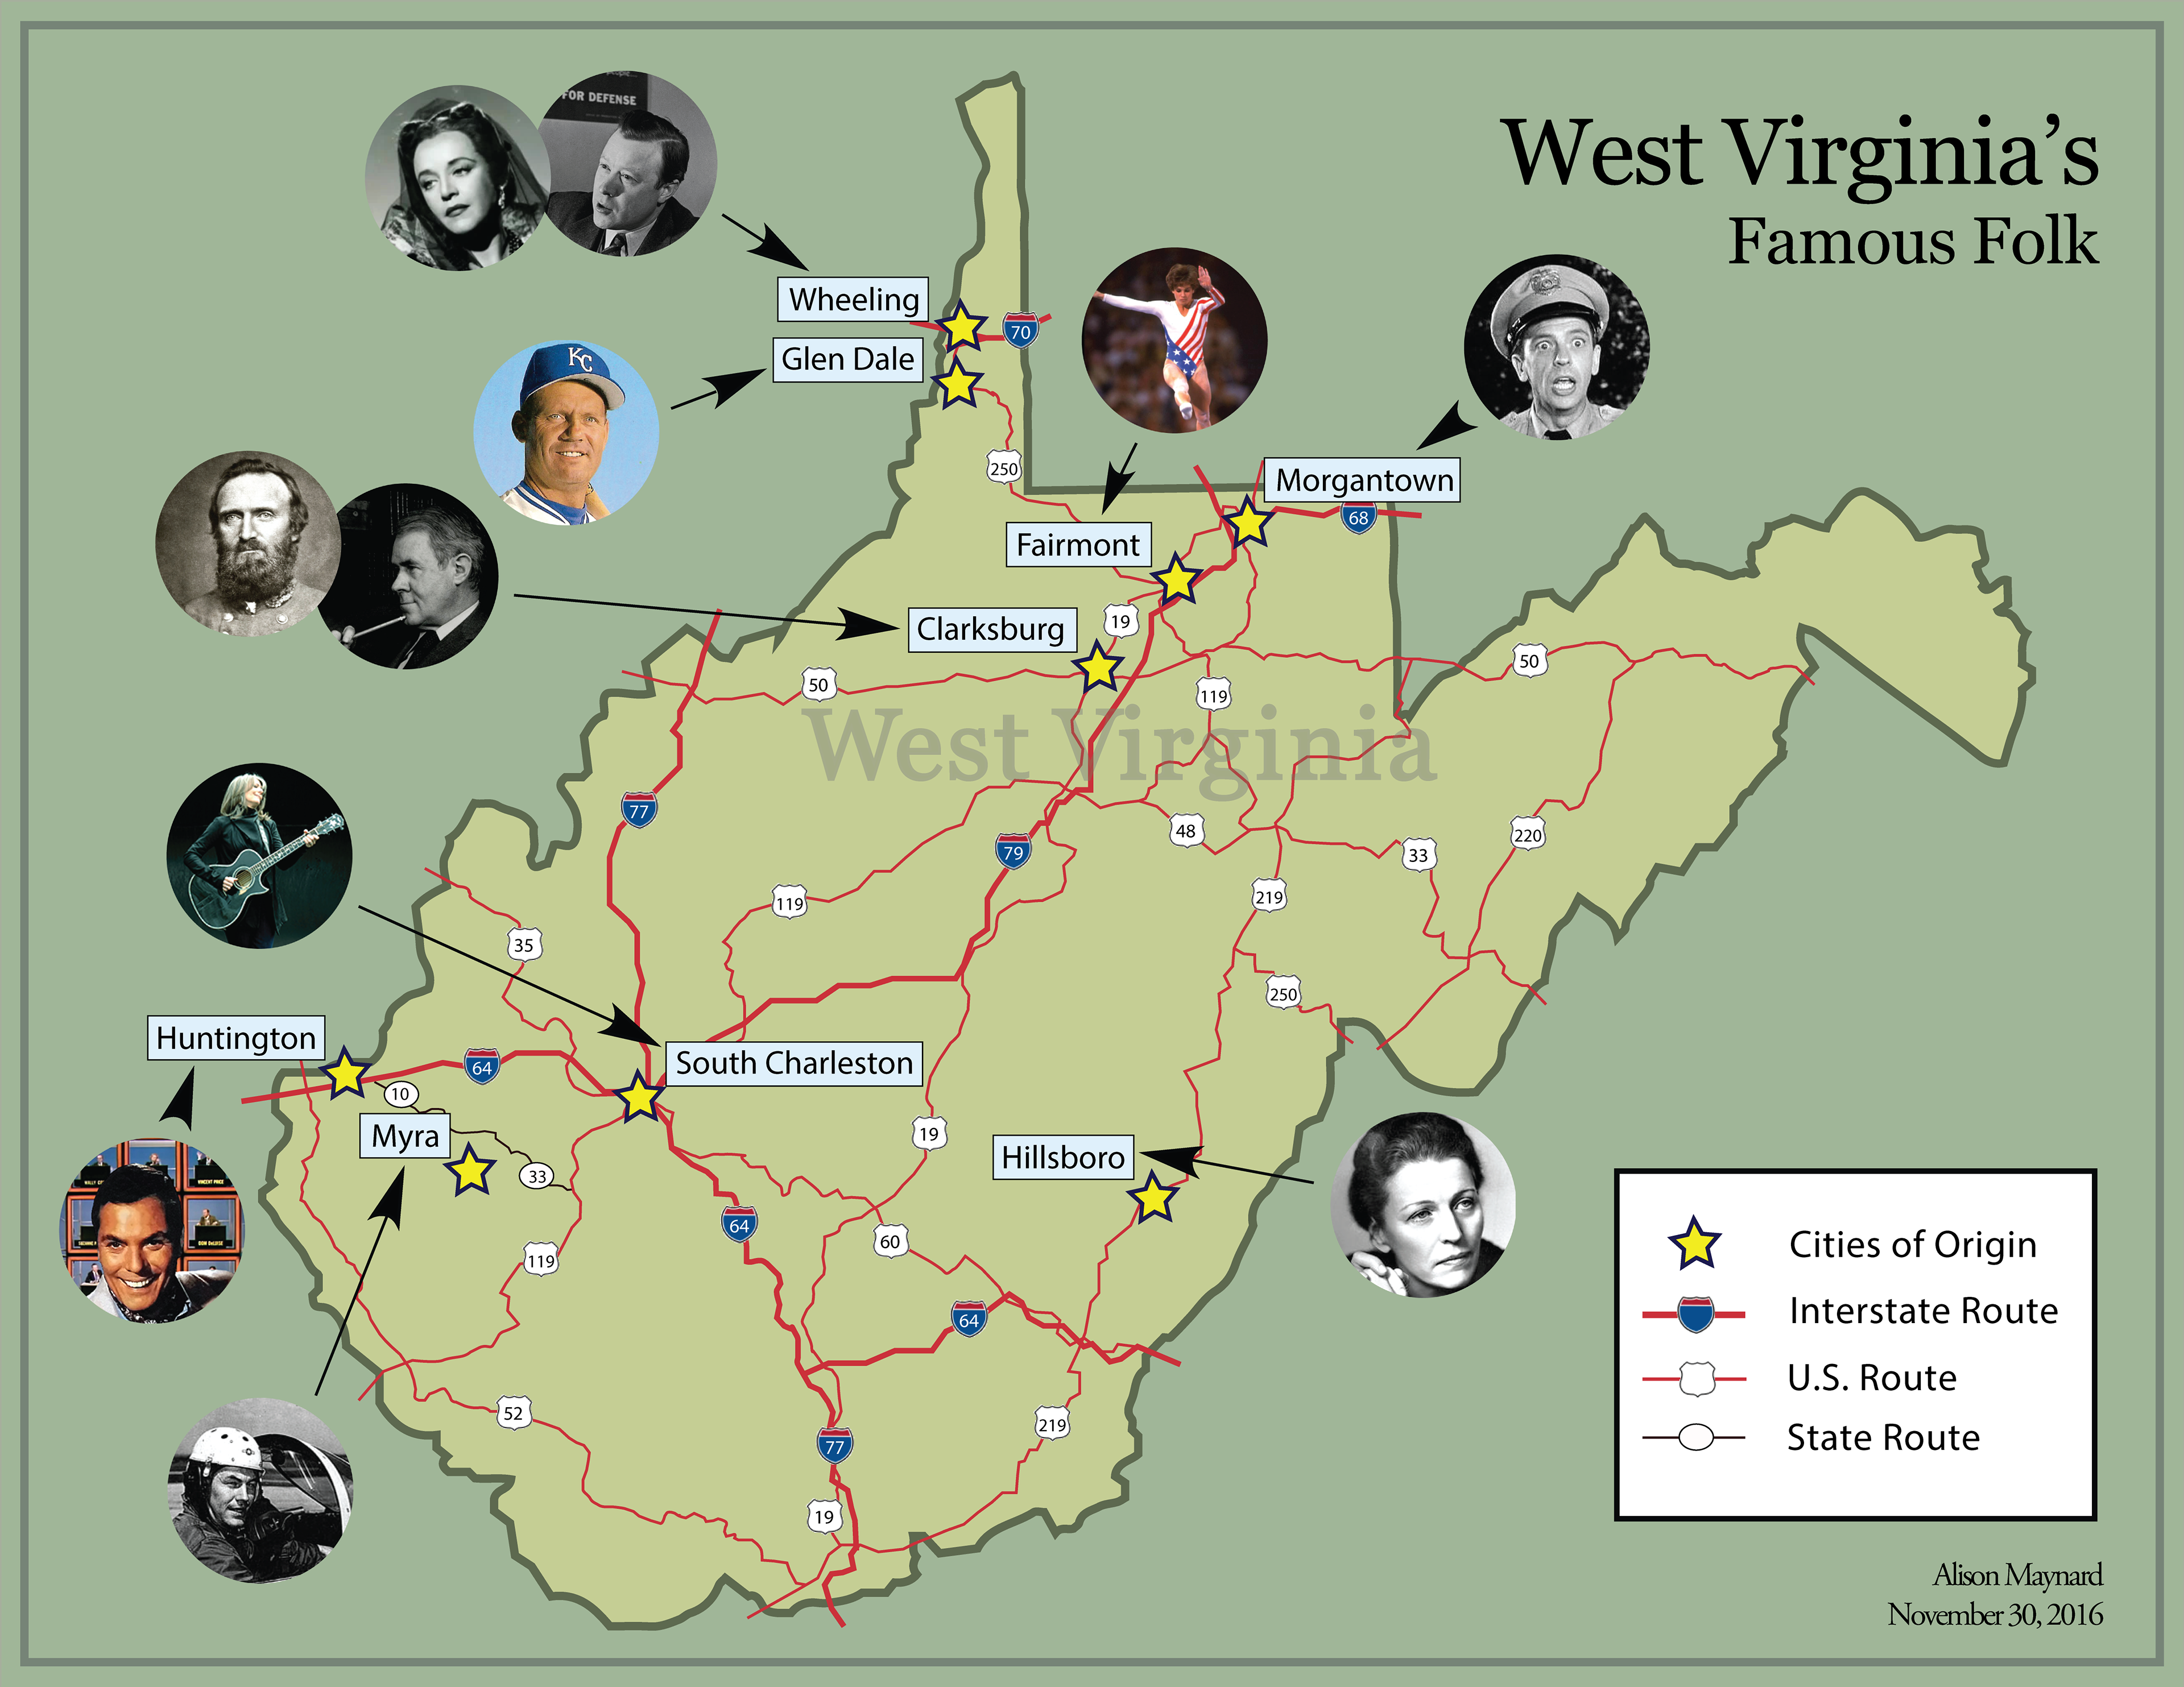
Travel Brochure
This project involved creating a double-sided, trip-fold brochure highlighting "some aspect" of West Virginia. The requirements were to include a self-created, full map of the state on the backside, and to highlight at least 7 different cities. The rest was up to me. (2017)
Employed: Adobe Illustrator & Photoshop
Created for 8.5" x 11", two-sided, tri-fold presentation